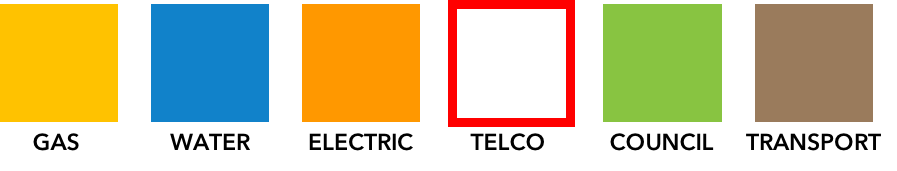
Colours – used to differentiate organisation type
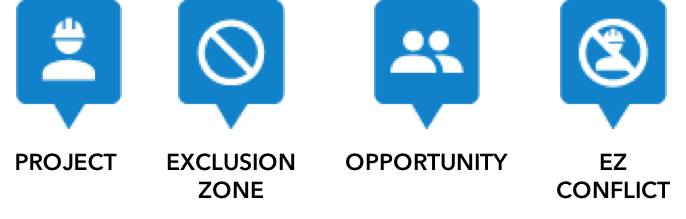
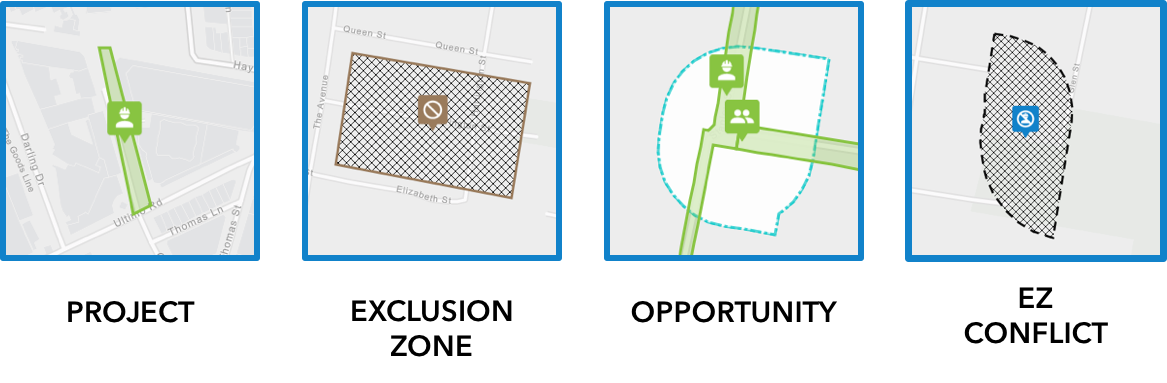
Symbol – used to differentiate object type
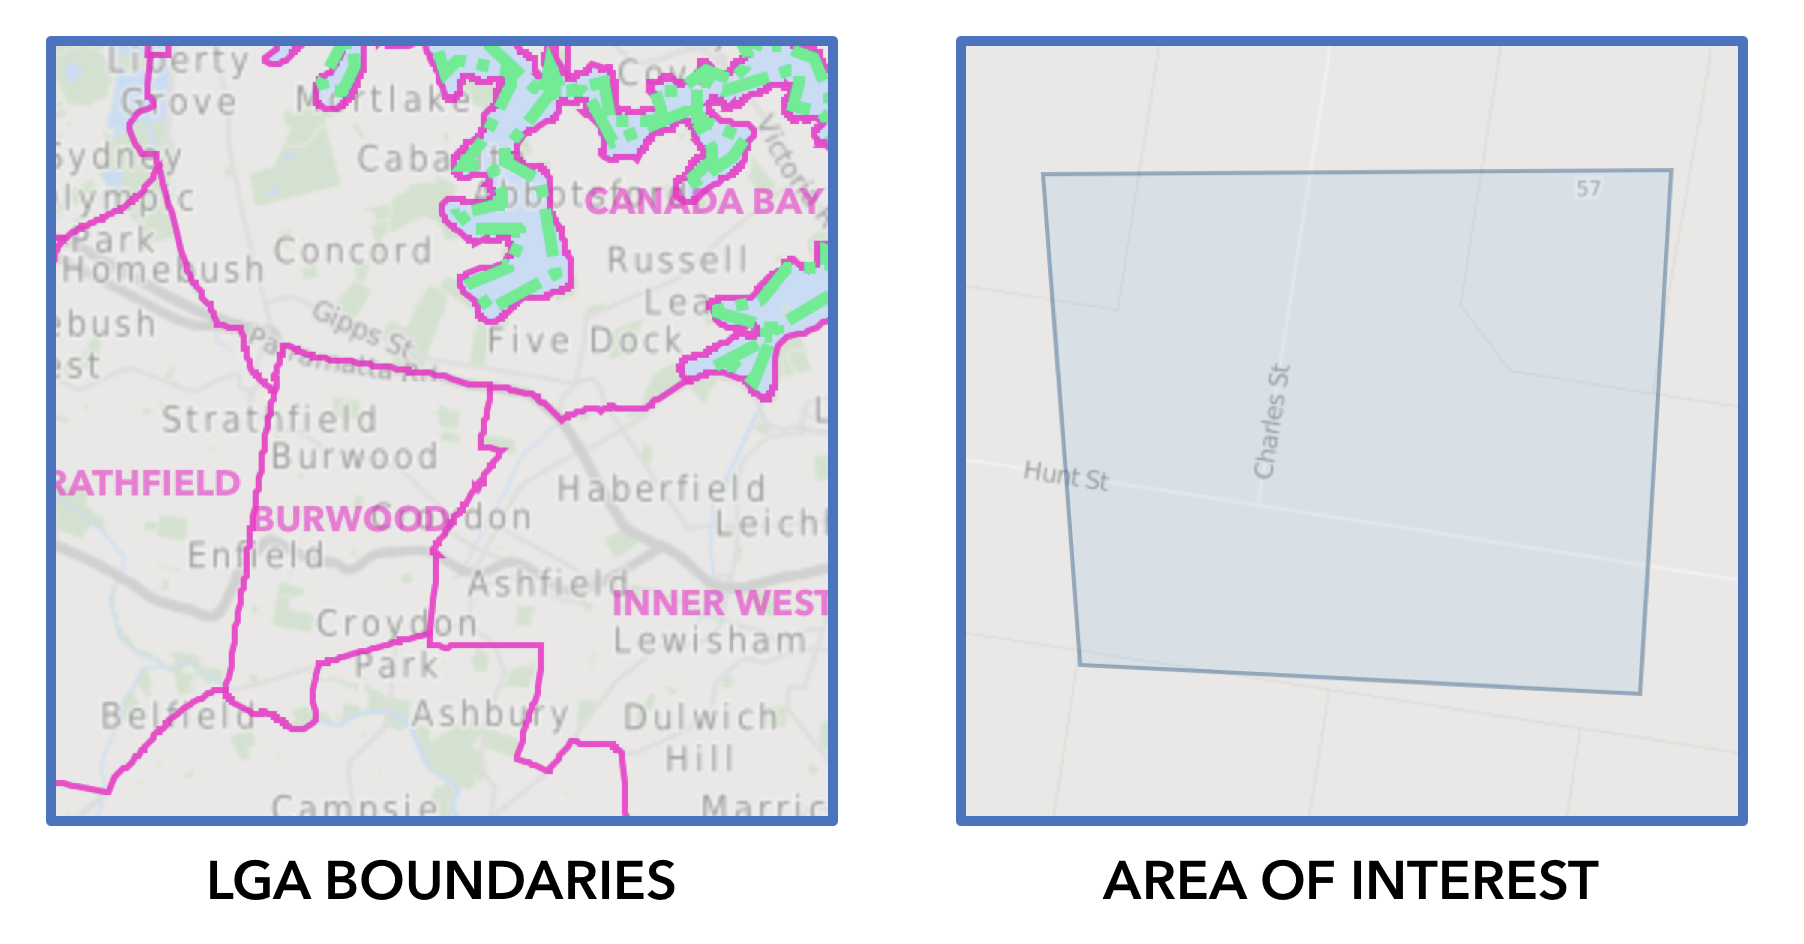
Shading – used to differentiate map regions
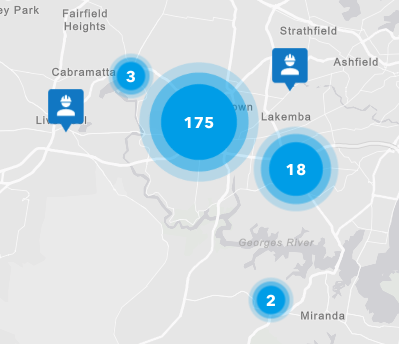
Clusters – used to display large numbers of overlapping items on the map. Click on the cluster symbol to zoom in and reveal more detail.
Additional Layers – your map will also show Local Government Area boundaries and any Areas of Interest you have created if you have these turned on in the map settings.